An interactive dashboard designed to track and visualize key metrics like sales, customer satisfaction, deliveries, and acquisition. Built to strengthen skills in KPI analysis, pivot table summarization, and data-driven storytelling.


Used Python to simulate and analyze a bank's operations, identifying actionable process improvements that enhanced throughput and cut wait times by nearly half, without increasing cost.
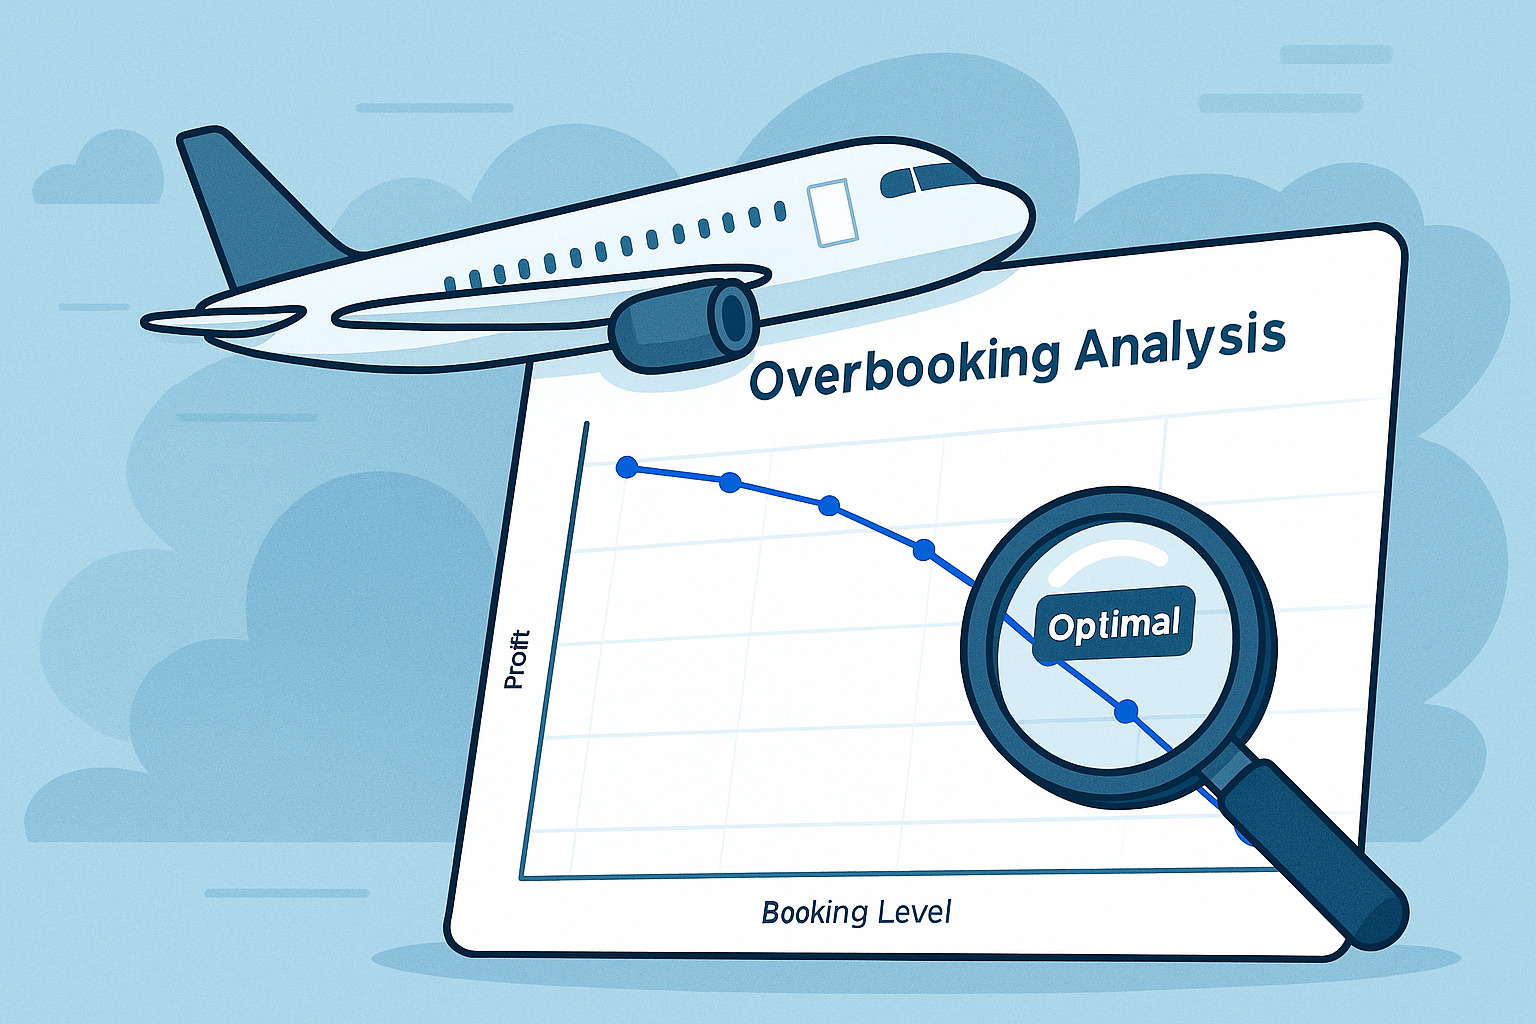
Developed a predictive model using historical data to determine the ideal overbooking level that maximizes flight profitability. Leveraging simulations to then provide strong evidence pinpointing the exact overbooking level that would maximize profits.
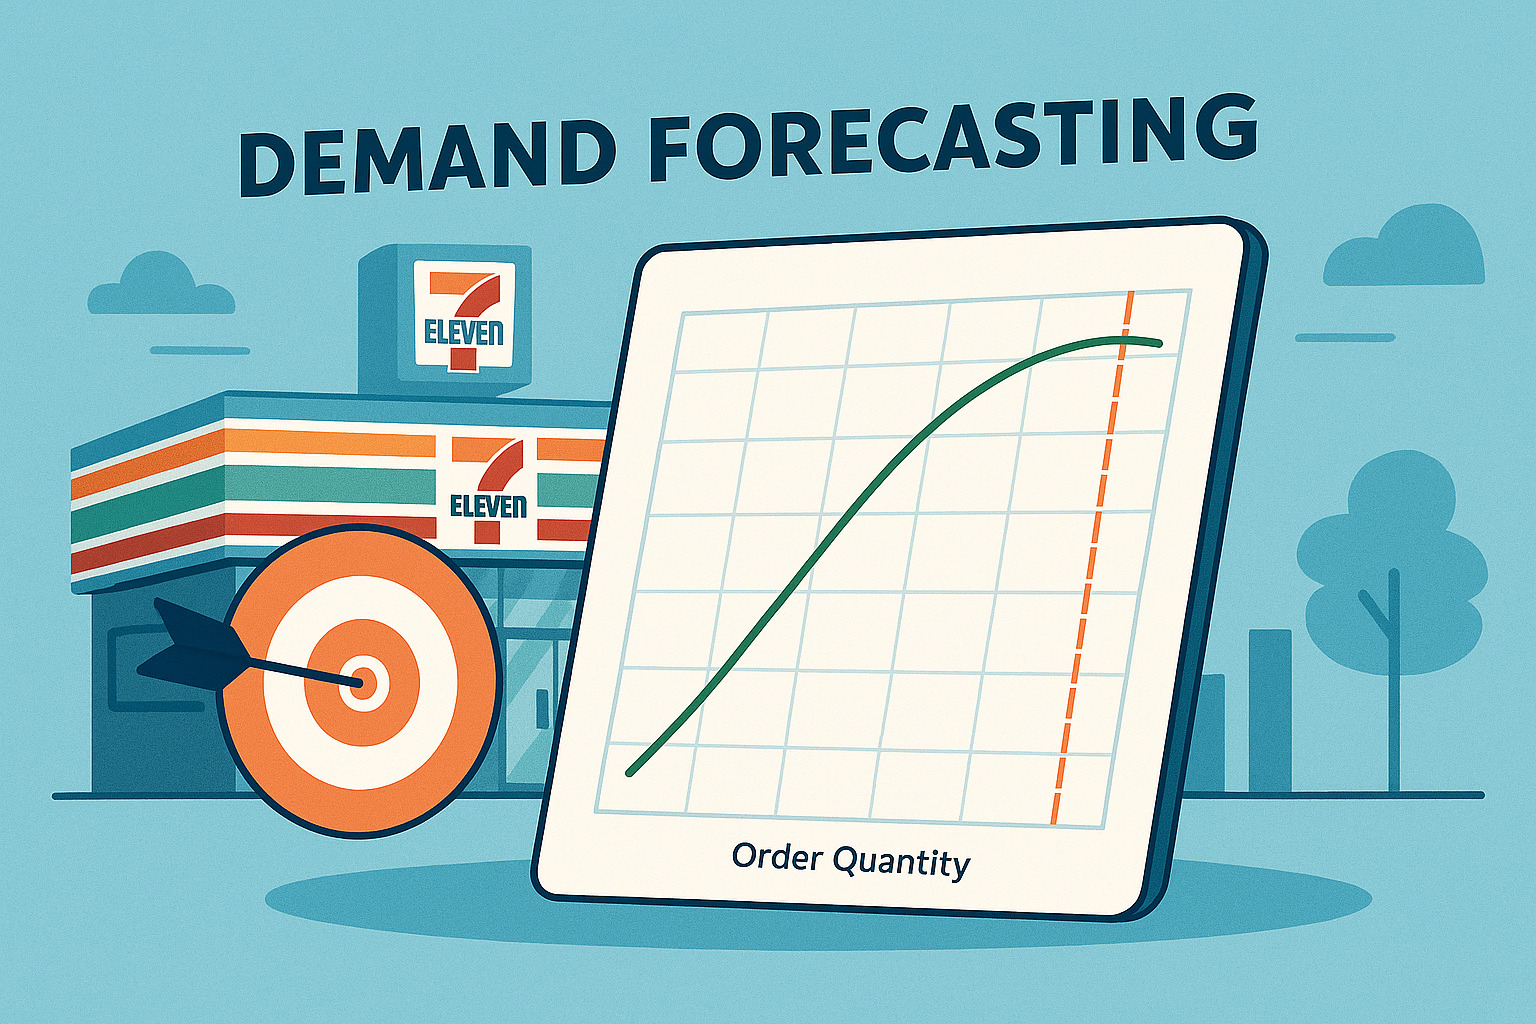
Used a 10-day moving average to forecast day 501 demand for a convenience store's product (rice ball boxes), enabling precise, data-driven purchasing decisions. Identified the optimal order quantity that maximizes profit while minimizing waste.